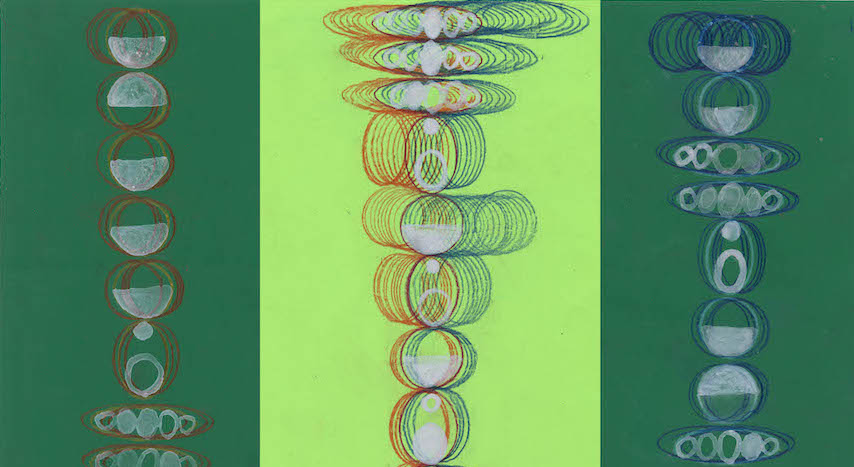
A Data Love Story is part of a larger collaboration stemming from a shared concern with the assumed neutrality of data. Data is extracted, mined and valued in line with human (often corporate or political) interest. Our personal experiences are increasingly mediated by technological tools, but our data is rarely accessible (seen, understood, or used) by those who produce it constantly and unconsciously.
In A Data Love Story, we take an approach of curiosity to our own data. Do the words we exchange with romantic partners still have resonance when they are extracted, quantified, exchanged across continents and represented as data visualisations? Or, does this process render them inert?
In spring 2021, Meadhbh went through a break up, and Margaux suggested the idea of a linguistic analysis, looking at text message samples from different phases of the relationship. Margaux approached the concept with a detached curiosity, while Meadhbh was unsure about the emotional consequences.
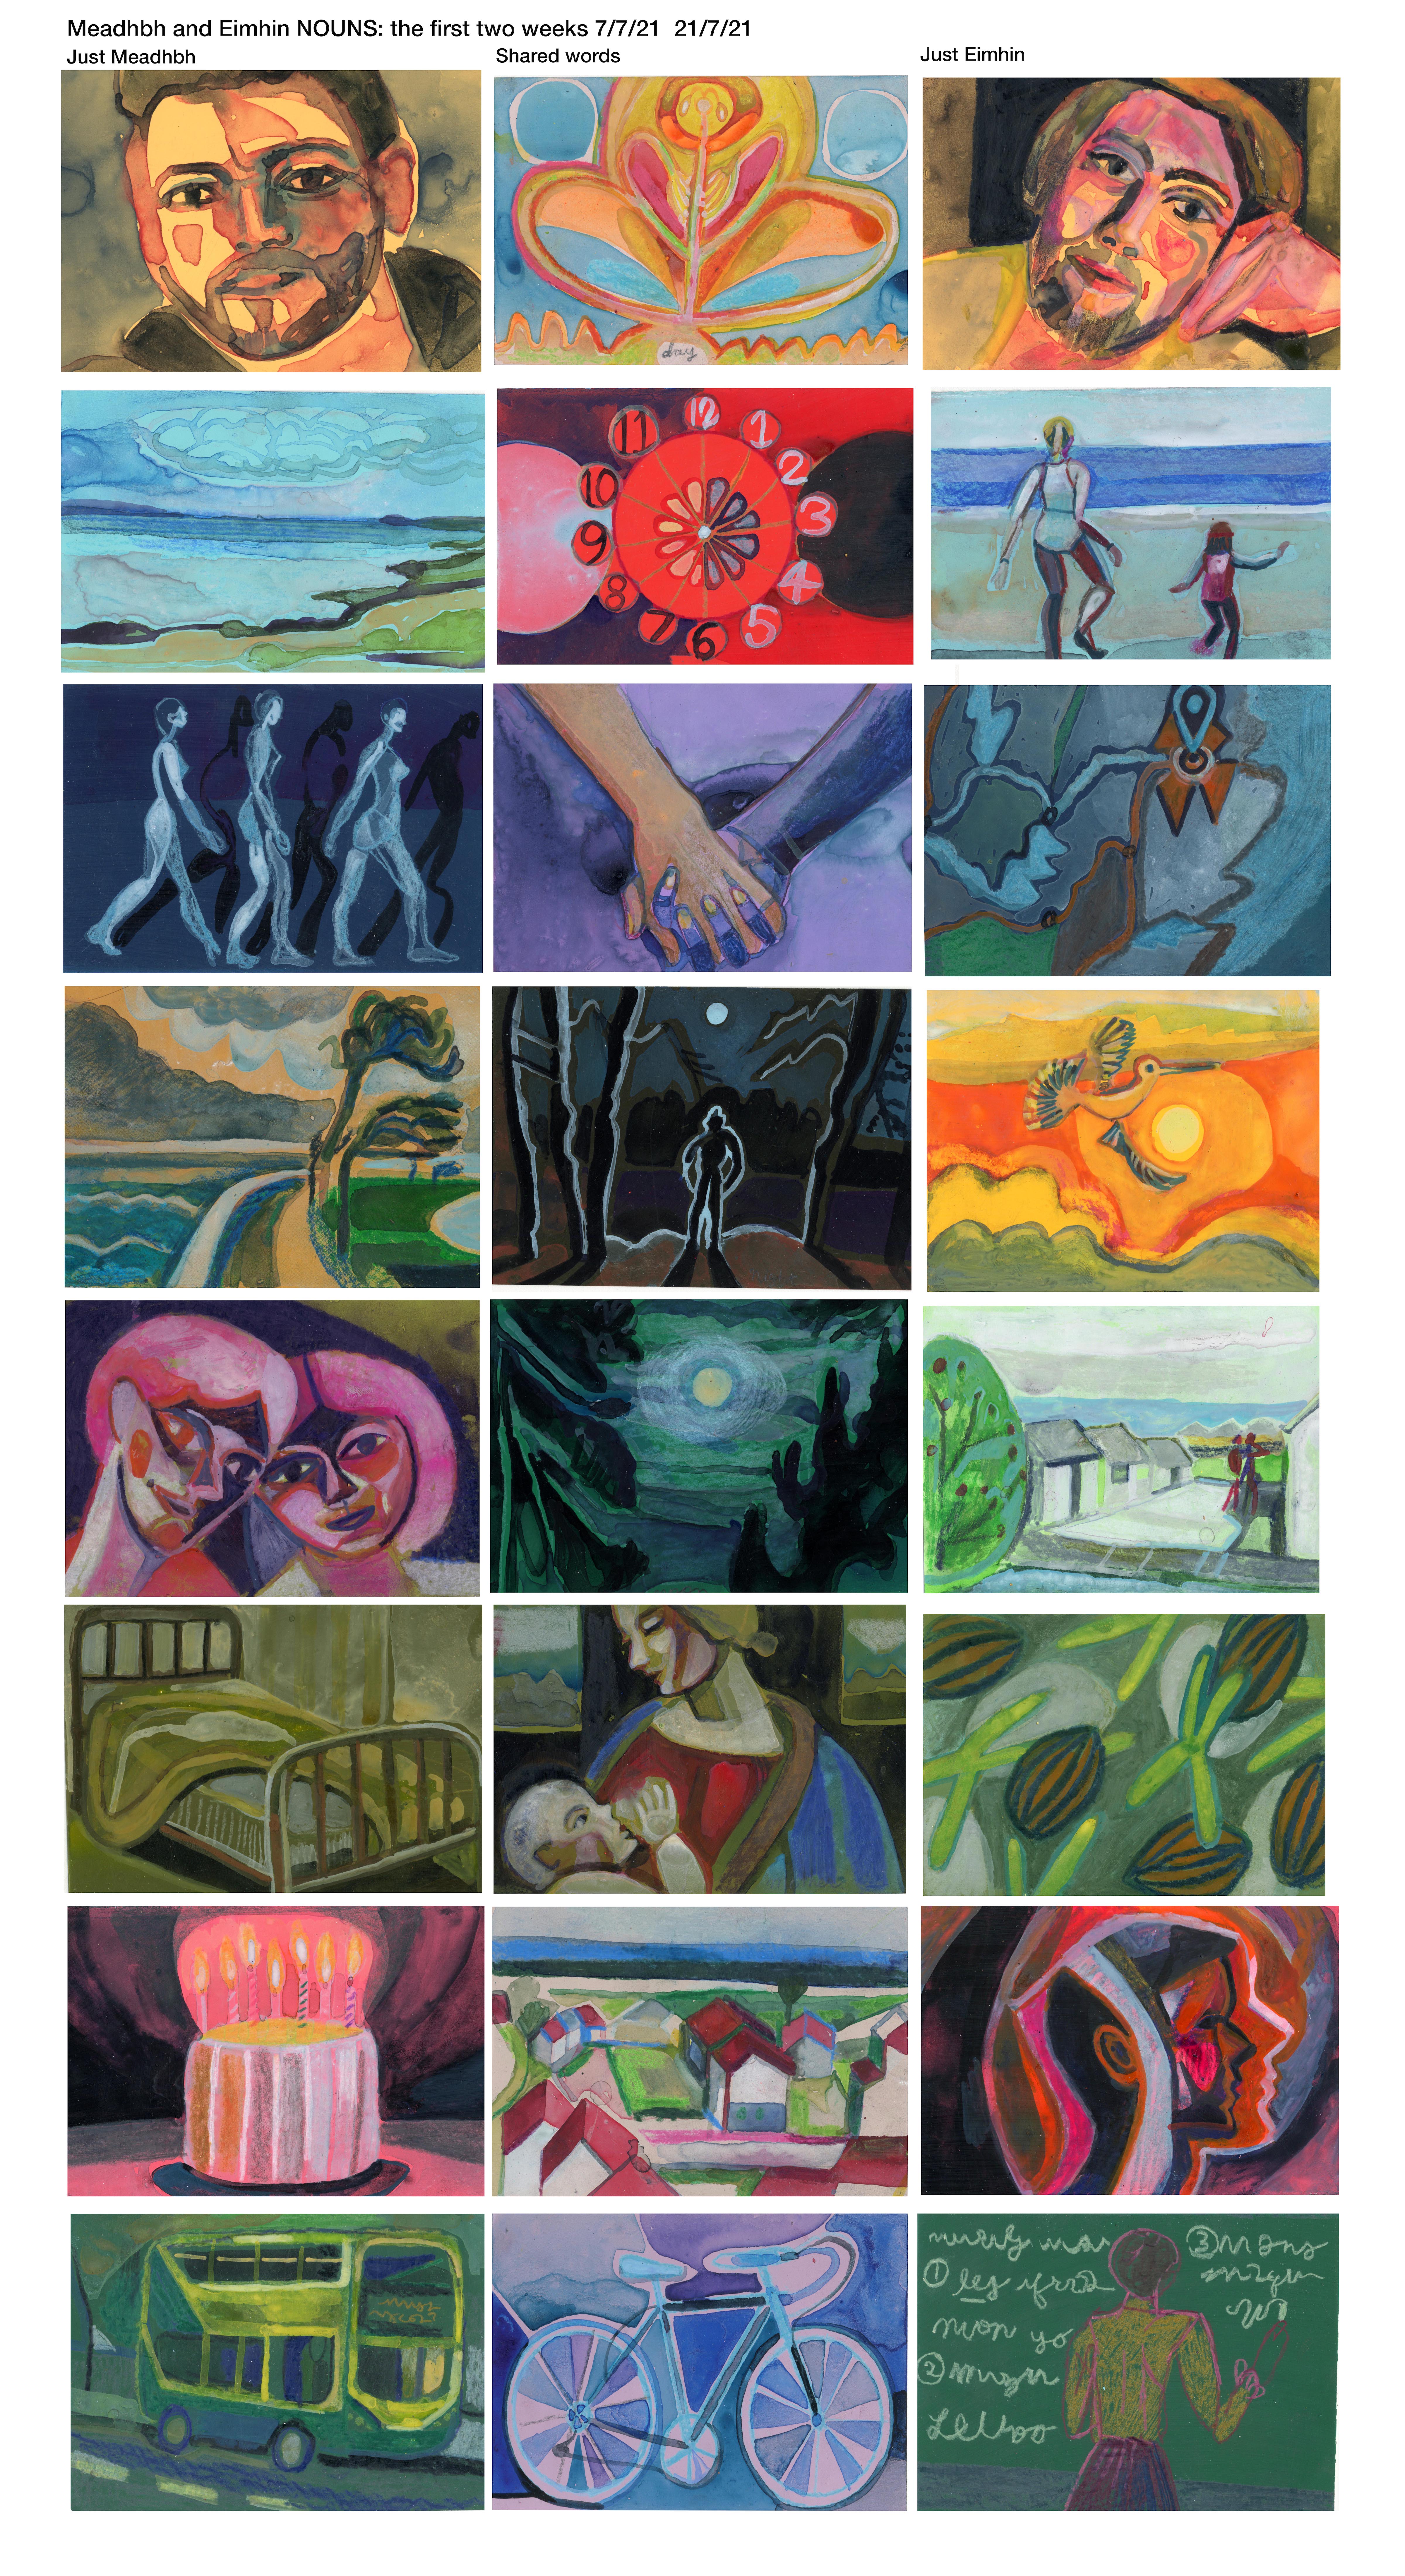
Later in the year, Meadhbh met someone new and the idea to collaborate reemerged in a totally new context. The images below draw from a living love story, unfolding in real time. Meadhbh and Eimhin were curious to see their lives interpreted and mirrored by a distant analyst. Can a person on another continent, far removed from the details of the relationship, find meaning in studying linguistic patterns (verbs, adjectives and nouns)?
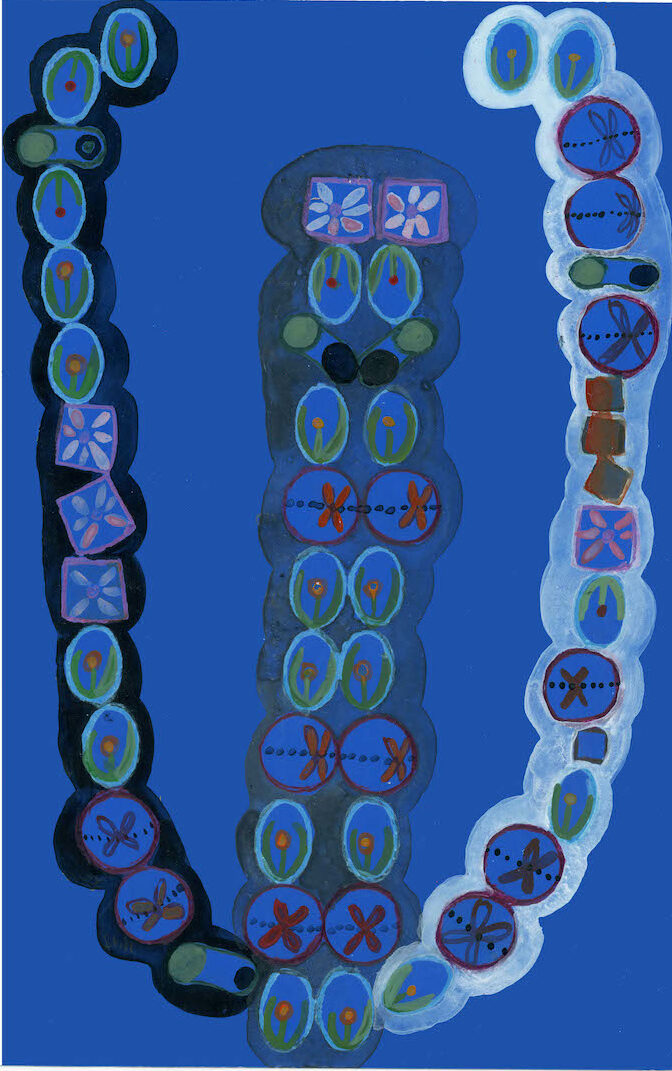
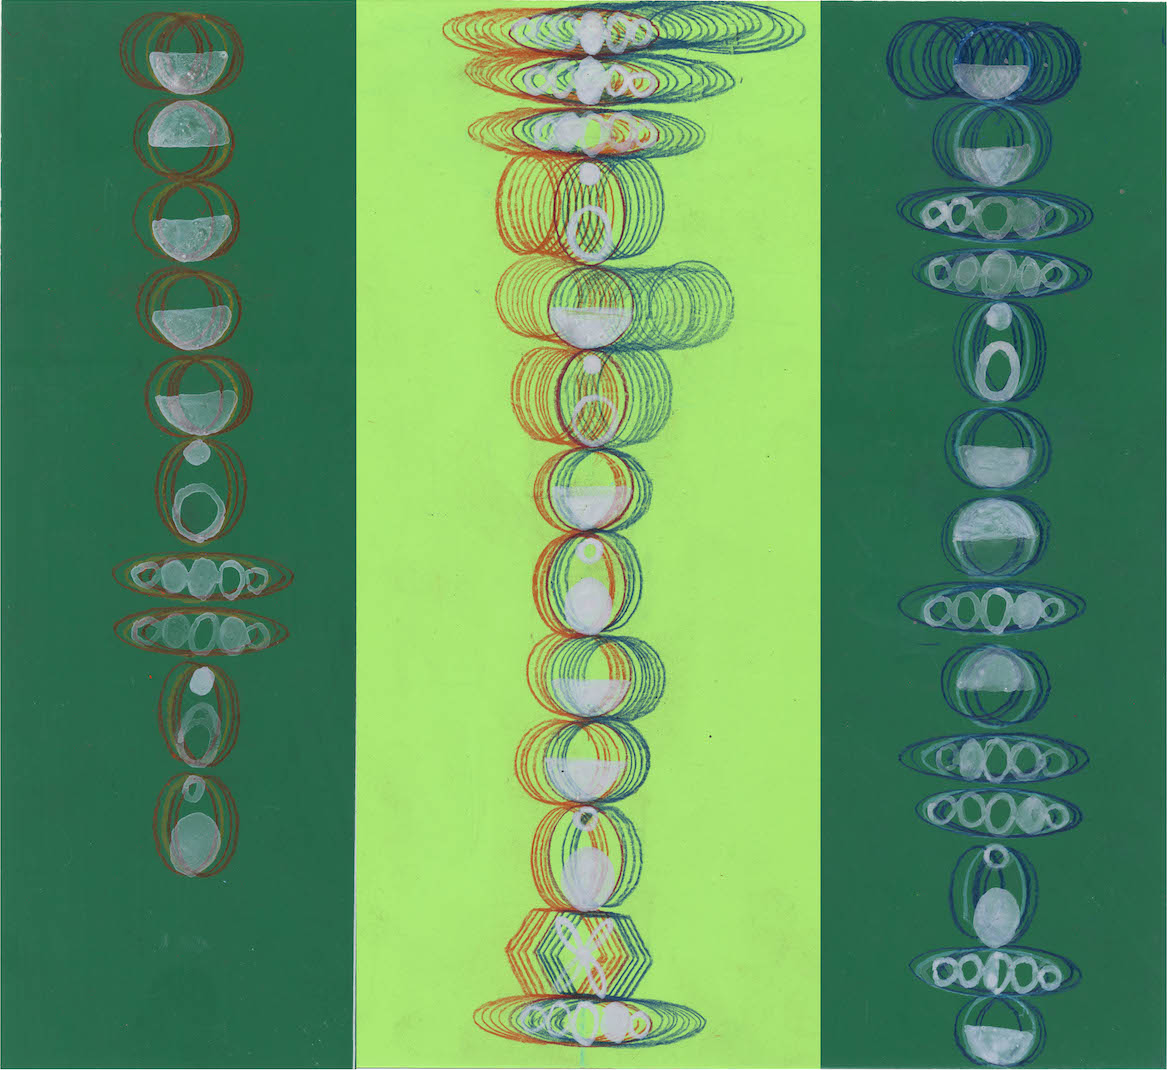
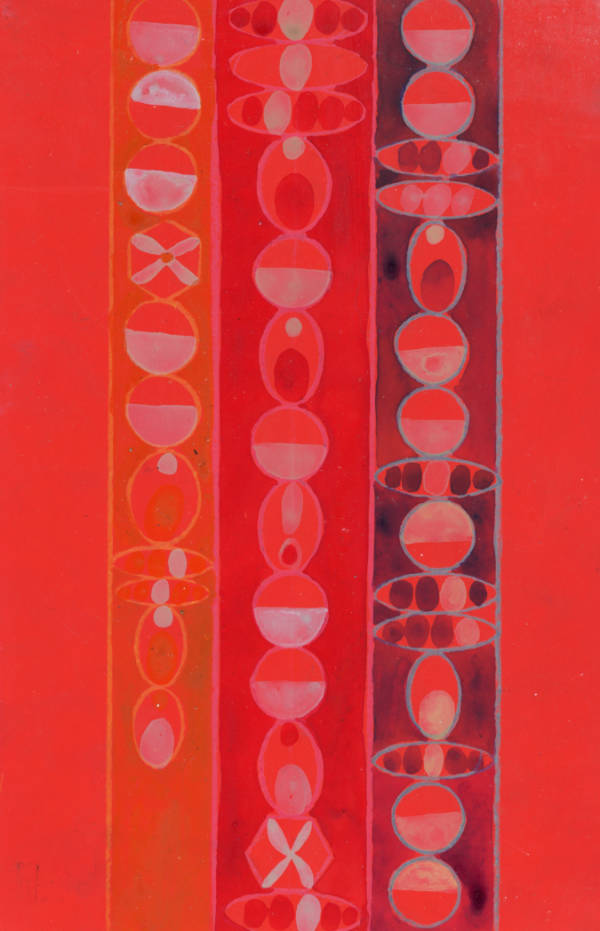
Mining data from texts exchanged across two fortnight periods, Meadhbh began to share information with Margaux, documenting the process in a creative text titled Steps to Construct a Data Story. Health problems disrupted the linearity of this process. Little resistances of the body and possibilities for human error are present throughout the text. Similarly, the tactile details of Margaux’s visualisations highlight the subjective nature of data analysis.
Margaux uses analog methods, drawing from craft and textile design to visualise “small data” through ornamental images. Her work is inspired by data humanists such as Giorgia Lupi, historical pre-digital visualisations, and modern artists like Paul Klee and Gunta Stölzl. Incorporating text, photography and installation, Meadhbh’s practice teases out the ethical dilemmas of documentation in the attention economy. In earlier projects, Meadhbh has programmed interactive light sculptures using biometric data from exhibition visitors. Her recent written publications focus on processes where intimacy, creativity and data harvesting meet. In A Data Love Story, both artists admire the beauty of data processing, while agitating its illusions of immateriality and objectivity.
Steps to Construct a Data Story
1. Export
Open up an app, let’s call it the vault. The vault is lubricant for all of your plans. A small phone icon at the top of the screen reassures you that life is in motion again, be it practically (a trip to the shops) or ideally (a relationship). The vault is quiet—no ads or likes. Send a message, and receive a response. Check back later; the message remains. This particular vault harbors intimacy: virtual real estate for you and E.
You agree to esoteric notes. Now, software like blades plow the fabric of your day, gathering ripe information. “This guy in Starbucks keeps farting! 🤢,” you say. “Grim,” he replies. And somewhere down the line, a transaction takes place.
The vault betrays its name, as per agreement. Five months of chatter take two short seconds to export and share. Send to yourself, and in the cold light of email, peruse its gutted contents.
2. Extract
From a hospital bed, compile your data into sets of his and hers, summer and winter. The first and most recent two weeks of coupledom. Extract yourself from the tapestry of a relationship. A column for you and a column for E.
Do it in short energetic bursts. At 4am, in between headaches – you may as well. Your bed is parked on the ward’s gossip corner. The gossip, while comforting, does not welcome sleep. The supply door swings on a fluorescent loop. Staff mill around like reluctant martyrs.
Type as night bleeds into day. List out verbs, adjectives, nouns.
Summer – ‘swim’, ‘Spiddal’ – ‘sweet’, ‘moon’.
Winter – ‘test’, ‘dizzy’ – ‘ward’, ‘ages’.
Tidy your data, taking regular breaks. In the corner, click share, and begin to type: M –
3. Share
Before your words arrive on Margaux’s screen, light must travel along fibre optic cables, measuring 6,000+ km in length.
Many gloved hands direct these cables. In boats, engineers go about repairs, arranging strands with pinprick precision. Fine hairs of glass slot into copper. Dipped in tar, they drape in silence across the deep Mid-Atlantic Ridge. Beneath them, the heart of the planet smolders.
A shark might grip one between his teeth, but most cables fail under human error. With the snag of an anchor, an entire island can drop off-grid for over a week.
Your code is somewhere along this route. When it arrives, you feel a gaze from Margaux’s small, round avatar. Her cursor flashes in pink, below yours.
The shock is wearing off now… Your head throbs with pressure. Rest for a while.
4. Create
You have inflamed your brain, the primary organ of the Information Age. In full health, your body mingled effortlessly with the digital. Now on strike, it refuses integration.
Call up Margaux. She sits on the floor, searching for patterns in the data from your vault. Her brush strokes form code: upward for positive, upturned for negative, flower for beauty, X for time. Question: “What do E and I look like in data?” Answer: “Small, beautiful feelings and time.”
Pouring over Margaux’s vault now – begin to build worlds. Think like an engine: a couple in Ontario, she in her 20s, he in his 30s. Words of affection and grocery lists. A decision is made to purchase a bed. “Plush”, he types. He is skeptical of the vault. Other vignettes: a cat sends hives across sensitive skin. Their dotted intrusion preserved in words, in the indefinite patchwork of the couple’s vault.
When you finish, look back at your story with E. Sand in sheets, catching the bus. A mother nursing their child to health. Making plans and getting by. Margaux writes, “That’s romance, baby.” Why not ‘stuff’ and ‘bicycle’ wheels? Why not ‘apples’ and ‘coffee’ and ‘bed’? So much of life is simply ‘bed’.
Profiles
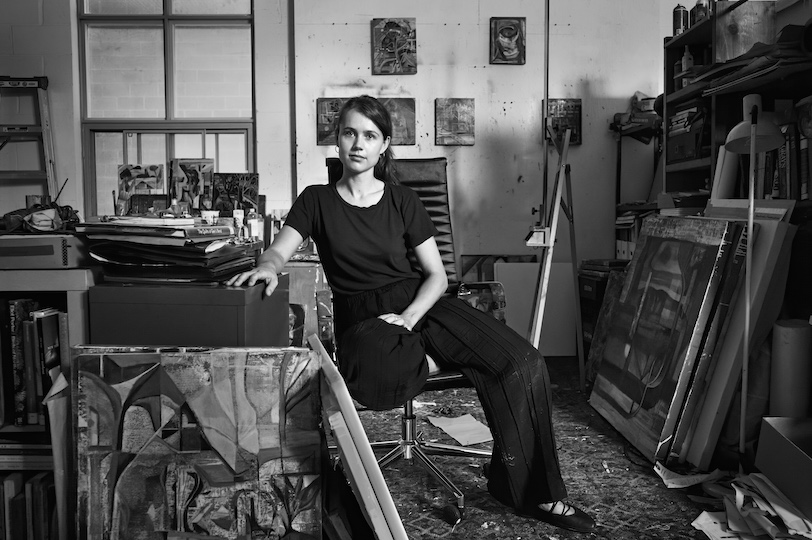
Margaux Smith uses layers of paint, drawing, and collage to convey the body’s state of constant transformation. The process of revision creates semi-abstract surfaces that replicate the instability of images and bodies. Born in Toronto, Smith received a BFA from OCAD University and went on to complete a Master of Information at the University of Toronto. Throughout her works on paper, Smith incorporates grids, graphs, and data alongside portraiture and figuration. She currently lives and works in Toronto.
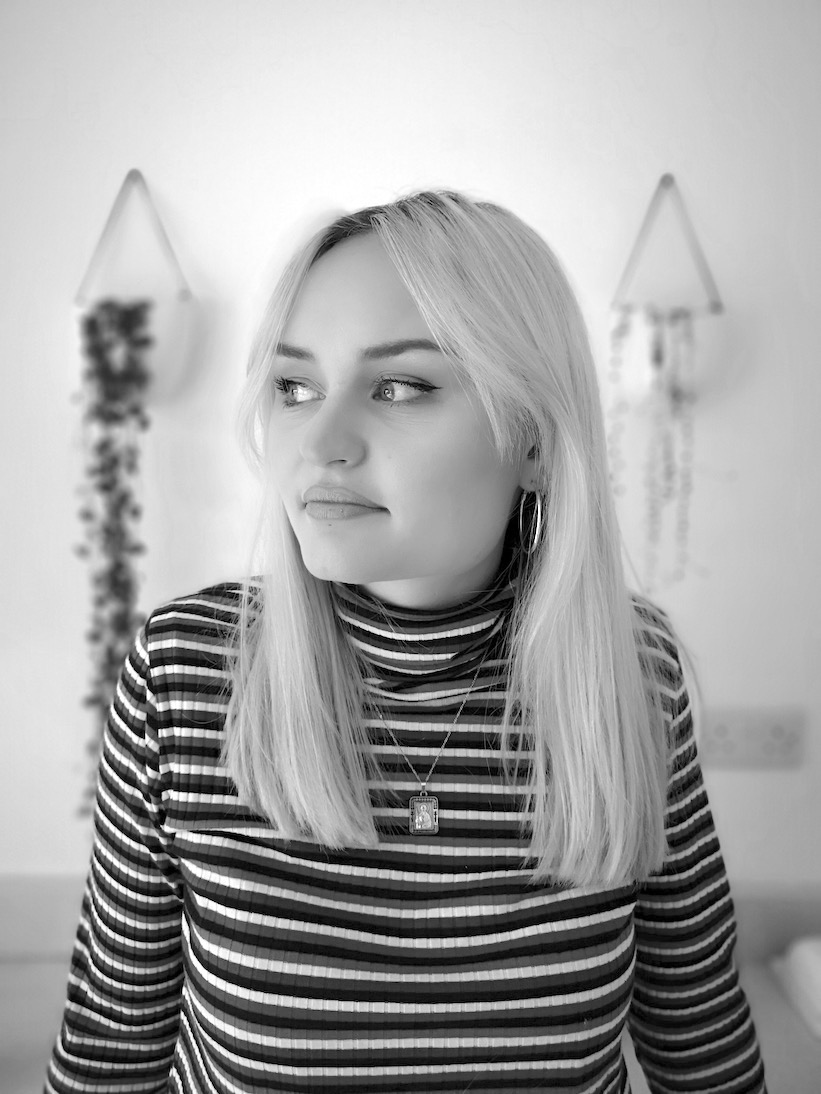
Meadhbh McNutt is an Irish artist and writer. Meadhbh's practice looks at questions of documentation, particularly where intimacy meets information. She has exhibited work internationally in Ireland, the UK, Hungary, Poland and Hong Kong. Her words and photographs can be found in publications including Tank Magazine and the Visual Artists’ News Sheet. A recipient of the VAI/DCC Art Writing Award 2020, she has written & edited for clients such as GARAGE Magazine (Vice Media) and The Douglas Hyde Gallery.
Meadhbh currently works freelance on the content team at NUI Galway. She has delivered talks at TU Dublin School of Creative Arts; GMIT Centre for Creative Arts and Media; Project Arts Centre, Dublin; The Model, Sligo, and recently facilitated a series of art writing workshops at CCA Derry~Londonderry.